|
|
|
|
 |
 |
|
Management & Optimization for SQL SSRS
|
|
| |
The Challenge
Reports for your SQL Reporting Services reports? Yes. 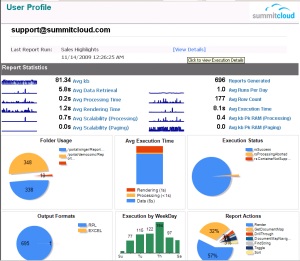
Want to know the longest running reports? Top users? Which reports should be
targeted for optimization and tuning? How about IT Governance; to determine
who's reviewing certain types of data, or who isn't using your platform at all?
Want to make sense of the SQL Server Reporting Services Execution Log?
Get it now.
Do you have multiple reporting instances or provide a multi-tenant platform for
SSRS? Do you need to know how much bandwidth reports, sites or users are
consuming?
The Solution
SCRUBS - SummitCloud Reporting Utility Belt for SQL Server provides a complete
infrastructure to review report execution, metrics and analysis of your
reporting environment. |
|
|
|
|
|
|
|
Premium Edition Report Catalog |
|
|
|
SSRS Performance Reports
|
|
|
|
Scrubs Dashboard
Only in Scrubs 2012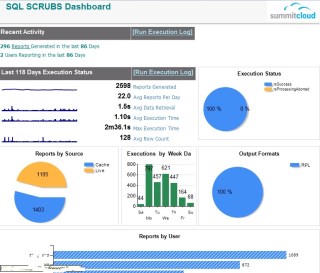
A launchpad for audit of the past week and month (adjustable) of reporting usage. Used as a lauch pad to drive to the Execution Detail and other reports.
|
|
|
|
Report Execution Log –
Enhanced Version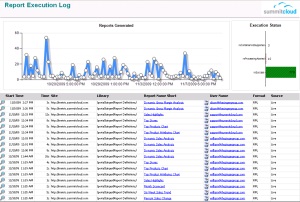
A detailed log of reports generated ordered by execution time. Enhanced version
allows for filtering by source type.
|
|
|
|
Report Summary Generation Statistics –
Enhanced Version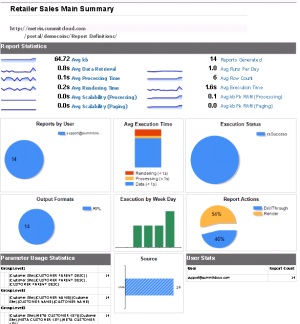
Provides average metrics related to the execution performance of a single report
over a user specified date range. Enhanced version adds traffic path analysis,
to analyze types of execution (render, drillthru, etc.)
|
|
|
|
Dynamic Top Reports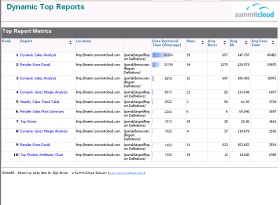
Adds flexible dynamic filters to the standard Top Reports analytic. View by
Average, Min, or Max for the following metrics: Processing Time, File Size, Row
Count, Peak Memory, and more.
|
|
|
|
Slowest Reports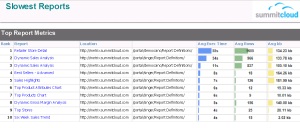
Analysis of the slowest reports (on average) for a specified date range.
|
|
|
|
User Profile
Dashboard of metrics by report user. Includes top reports, execution times, time
of day and more.
|
|
|
|
Largest Reports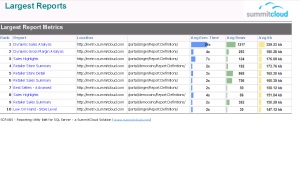
Analysis of the largest reports (on average) for a specified date range.
|
|
|
|
Site / Folder Statistics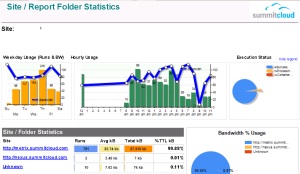
Displays usage statistics by Site/Folder with breakdown by hour of day, day of
week and % of data usage
|
|
|
|
User Statistics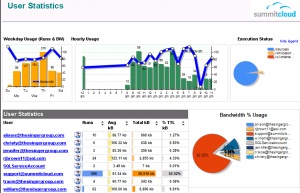
Displays usage statistics by report users with breakdown by hour of day, day of week and % of data usage.
Quick link to User Profile report.
|
|
|
|
Optimization Analysis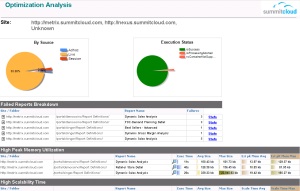
An exception reporting dashboard that displays reports that might be good
candidates for optimization based upon resource utilization and failures.
|
|
|
|
SSRS Instance Statistics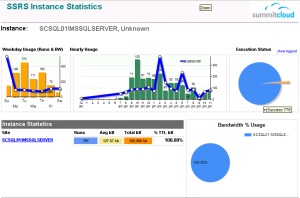
Displays usage statistics by SSRS Instance with breakdown by hour of day, day of
week and % of data usage.
|
|
|
|
SSRS IT Governance Reports
|
|
|
|
SSRS Report Catalog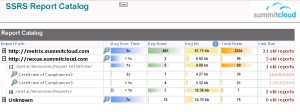
Full report catalog with usage statistics and links to drill-thru detail.
|
|
|
|
SSRS User Catalog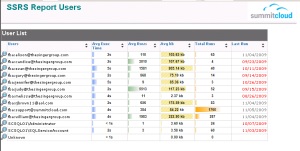
Listing of report users and usage statistics with linkage to User Profile.
Emphasis provided for users no longer using the SSRS catalog.
|
|
|
|
Parameter String Inquiry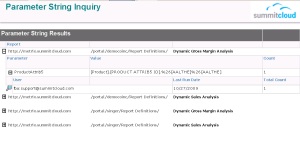
Answers the question “Who’s running reports for the ‘Higgins Account?’ This report
provides a text based search for character string in a Parameter.
|
|
|
|
Report Parameter Inquiry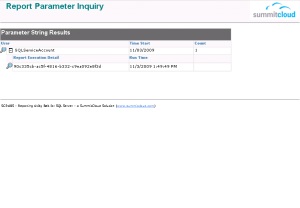
Retrieve user and report execution data based upon selected report parameters.
Determine who is running reports with specific parameter values.
|
|
|
|
Report Execution Detail with Path Analysis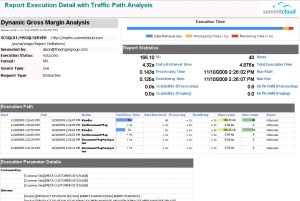
Displays the full detail of a specific report execution. Includes the action
path the user took while navigating within the report (Sort, Drill-through,
click Document Map, etc.) and the execution metrics for each action.
|
|
|
|
Get it now. |
|
|